Power & Sample Size
The grounded decision matrix: four claim tiers, the equivalence-margin trade-off, per-version minimum N, and the parameter-recovery caveat that governs what can honestly be claimed.
The claim-tier decision matrix
| Claim tier | Test(s) | Min N | Character |
|---|---|---|---|
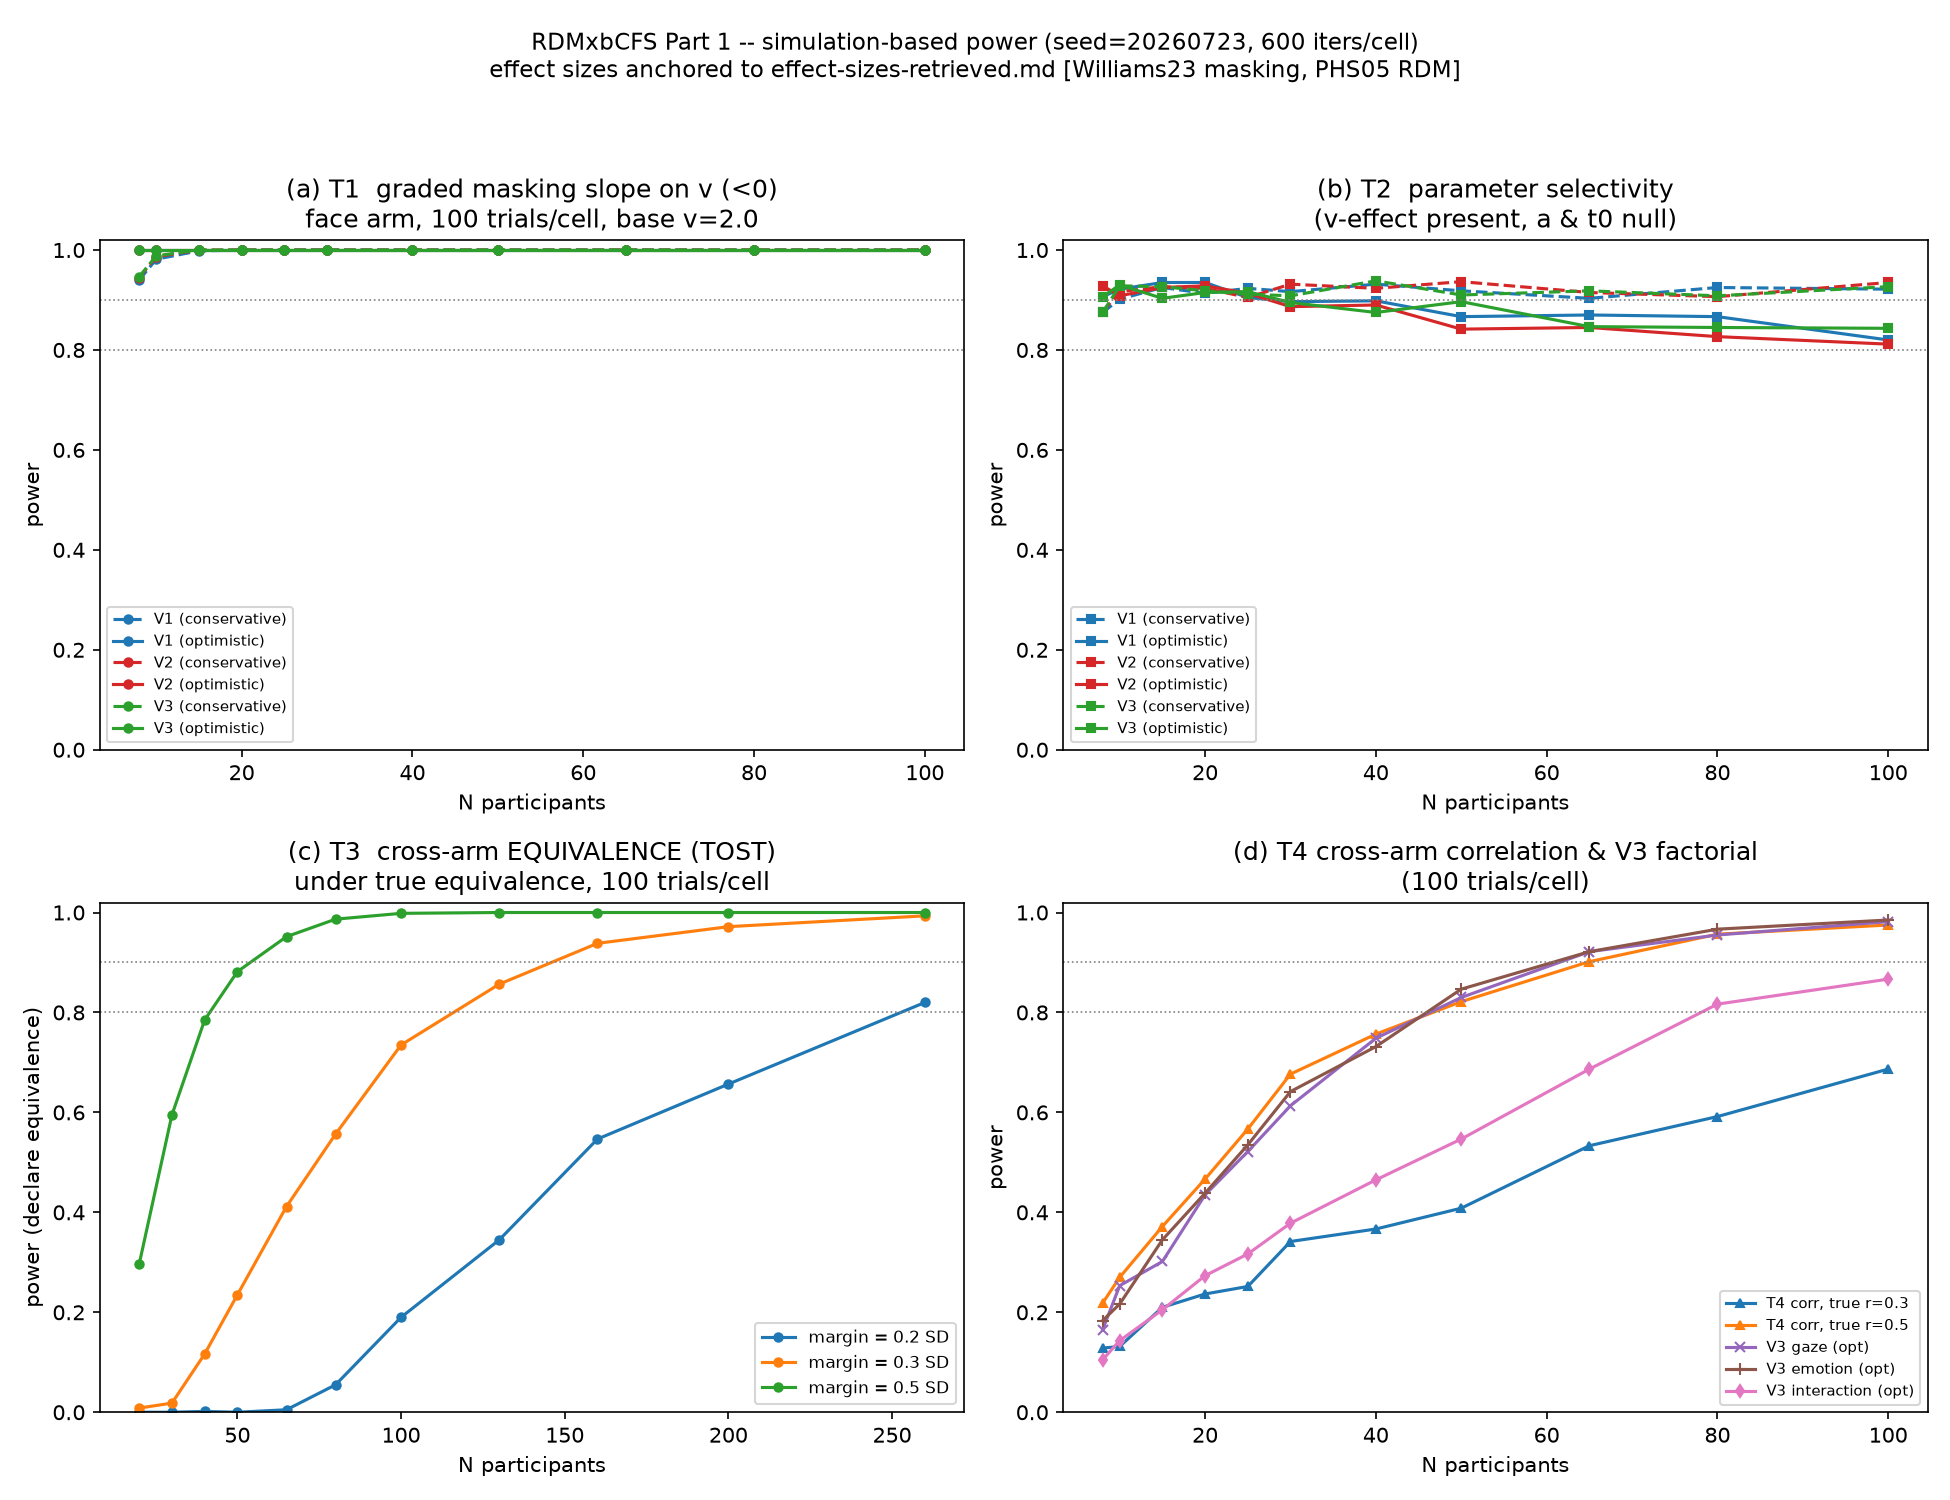
| ① Validation | T1 + T2 | ~12–16 | Pipeline reproduces masking→drift, drift-specific. Cheap, modest claim. |
| ② + Convergent validity | + T4 (r=0.5) | ~50–65 | Arms covary across people. Affordable, publishable. Recommended default. |
| ③ Strong equivalence | T3 (TOST) | 50 (Δ=0.5) · 130–160 (Δ=0.3) · 260 (Δ=0.2) | "Same process within a person." Margin is a PI judgment. |
| ④ Full factorial | V3 gaze×emotion | ~80 (optimistic) | Interaction on drift. PI leans here. Needs optimistic effects. |
Recommendation, by scientific goal
| If the headline claim is… | Recommended N | Which version |
|---|---|---|
| "Our pipeline reproduces masking→drift and it's drift-specific" (validation) | 12–16 | V1 or V2 |
| "Motion and face drift covary within people" (convergent validity) | ~50–65 | V2 (best-anchored) |
| "The two arms are quantitatively equivalent" (strong) | 130–160 (Δ=0.3) | V2, or V3 with N≥80 for interaction |
| Full factorial gaze × emotion | ~80 (optimistic) | V3 |
The equivalence-margin trade-off (T3)
This is the binding constraint and the PI's decision. A tight, defensible equivalence margin (0.2 SD) needs ~260 participants — infeasible for a first in-house study. A lenient margin (0.5 SD) is affordable (~50) but is a weak claim.
| Equivalence margin Δ (SD units) | min N (80% power) | min N (90% power) |
|---|---|---|
| Δ = 0.5 (lenient) | 50 | 65 |
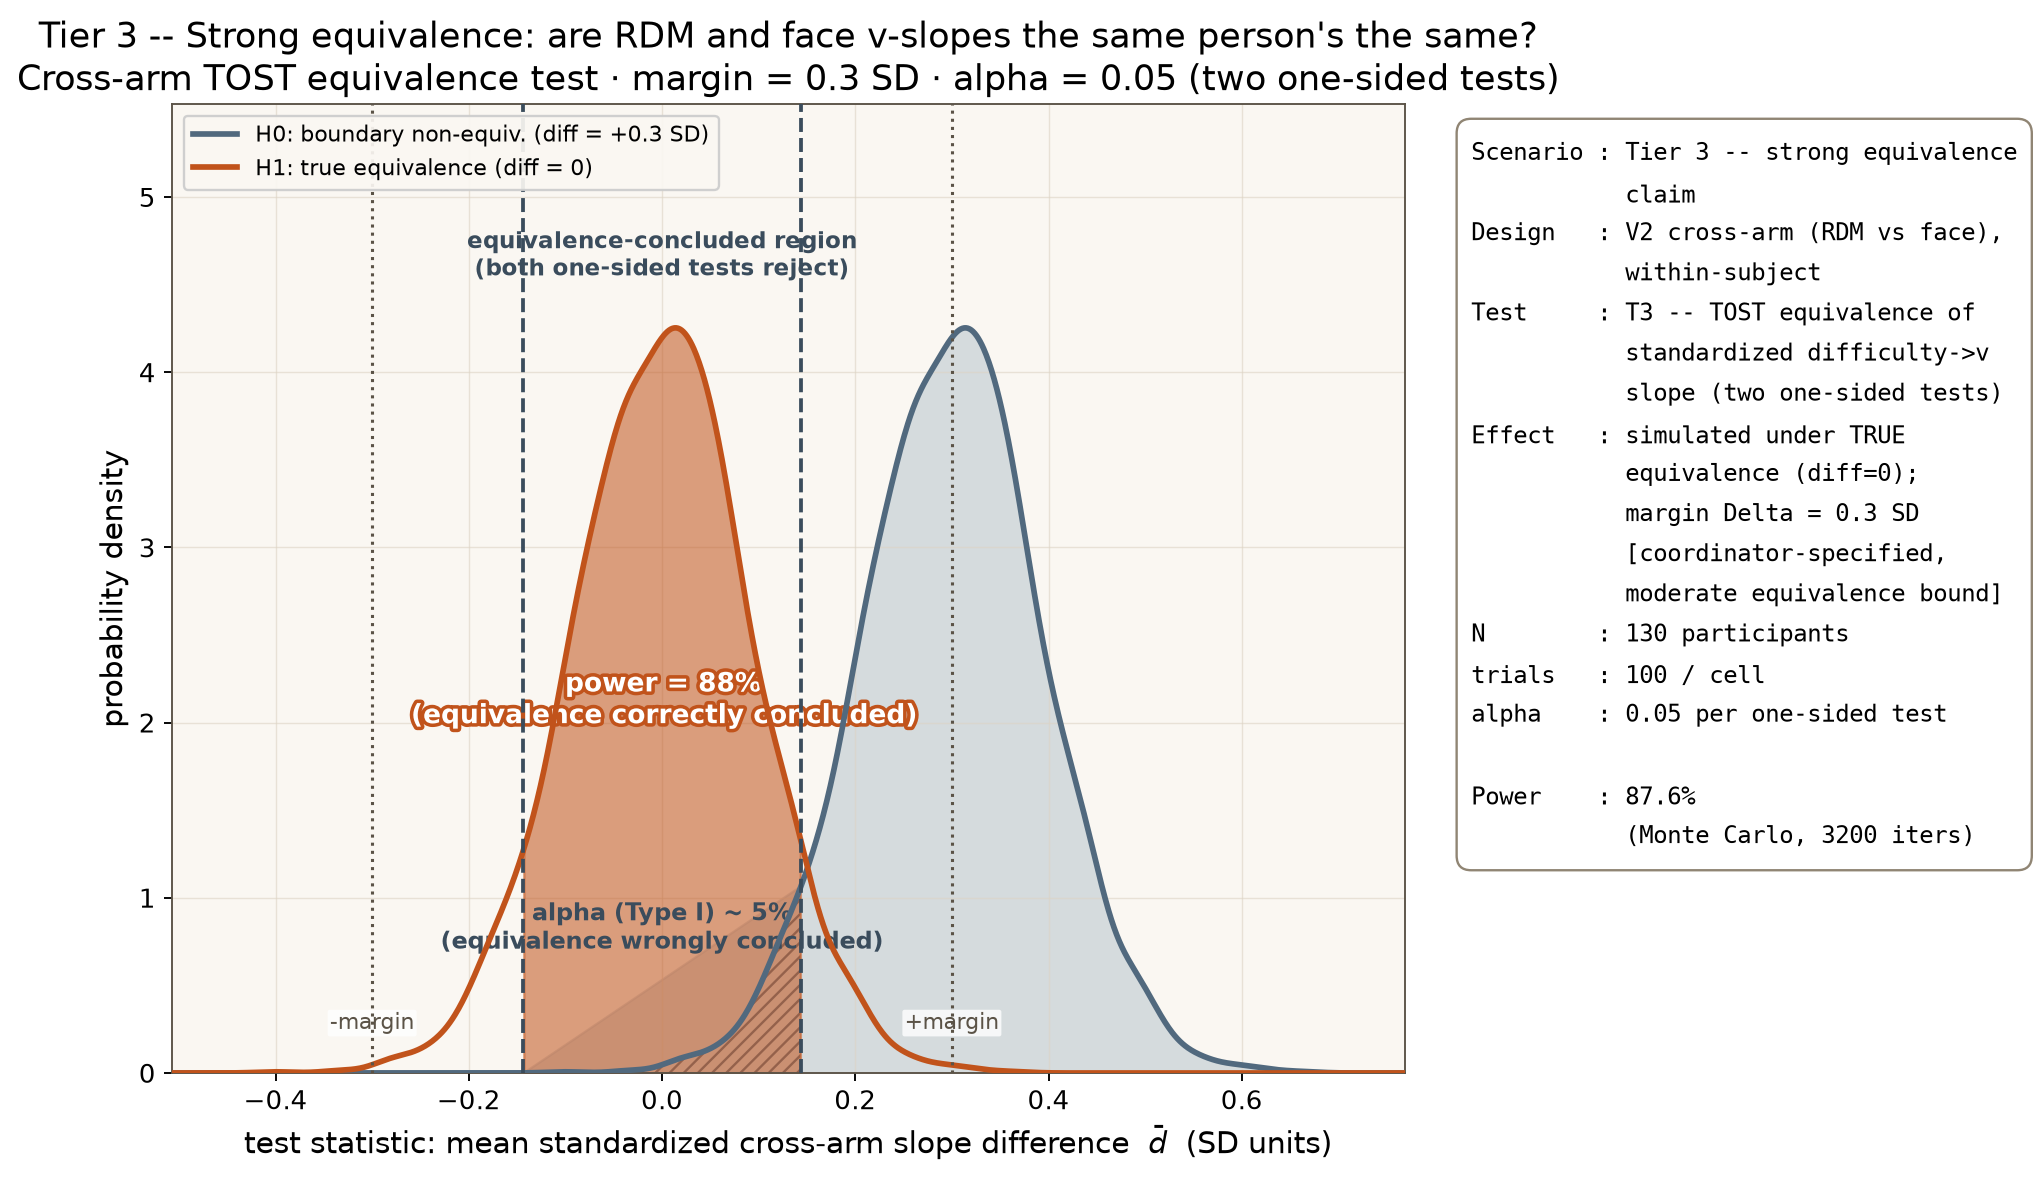
| Δ = 0.3 (moderate) | 130 | 160 |
| Δ = 0.2 (strict) | 260 | > 260 |
RDM & DDM best practices: where these numbers come from
A spoken walkthrough of the RDM/psychophysics literature (Palmer, Huk & Shadlen 2005PDF) that seeds the RDM-arm drift parameters used in this simulation.
Per-version N tables
Cheap tests (T1, T2) — the pipeline-validation core
| Test | V1 | V2 | V3 | Notes |
|---|---|---|---|---|
| T1 (masking lowers v) | ≤ 8 | ≤ 8 | ≤ 8 | floor-limited (grid starts at N=8); effect is very large |
| T2 (drift-specific) | 8–10 | 8–10 | 8–10 | see recovery caveat below |
Reproducing "obscuring lowers drift" and showing it is drift-specific needs only a handful of participants — a pipeline-validation study is inexpensive. But see the caveat below: T2's low nominal N is necessary but not sufficient.
Convergent validity (T4) — do the two arms track each other across people?
| True cross-arm r | min N (80%) | min N (90%) |
|---|---|---|
| r = 0.5 | 50 | 65 |
| r = 0.3 | > 100 (not reached in grid) | > 100 |
Attenuated by measurement error in recovered drift, so higher than the textbook N for a raw correlation.
Factorial (V3) main effects and interaction
| Contrast (optimistic effects) | min N (80%) | min N (90%) |
|---|---|---|
| Gaze main effect | 50 | 65 |
| Emotion main effect | 50 | 65 |
| Gaze × emotion interaction | 80 | > 80 |
Under the conservative bracket, V3 main effects/interaction are not reached within the grid — the factorial version is only viable under optimistic effects or with N ≥ ~80.
How we choose N — H0 vs H1
Each figure below is a genuine Monte Carlo simulation (3,200 iterations per arm,
power_figs.py, re-using power_analysis.py's exact Euler–Maruyama
DDM simulator, EZ-diffusion forward/inverse equations, and calibrated fast sampler — no new
generative model was introduced). Each panel plots the sampling distribution of the actual test
statistic under the null (H0 — no effect) and under the
alternative (H1 — the effect at its assumed size), at the N the report
recommends for that claim tier. The α = 0.05 critical value marks where the
null distribution is cut off — the shaded tail beyond it is the false-positive rate the test
accepts; the shaded power region is the area of the H1 curve beyond that same
cutoff — the probability of correctly detecting the effect at that N. Where a test has no
single null/alternative pair in the usual sense (the TOST equivalence test, scenario 3), the
geometry is adapted and explained in that figure's caption.
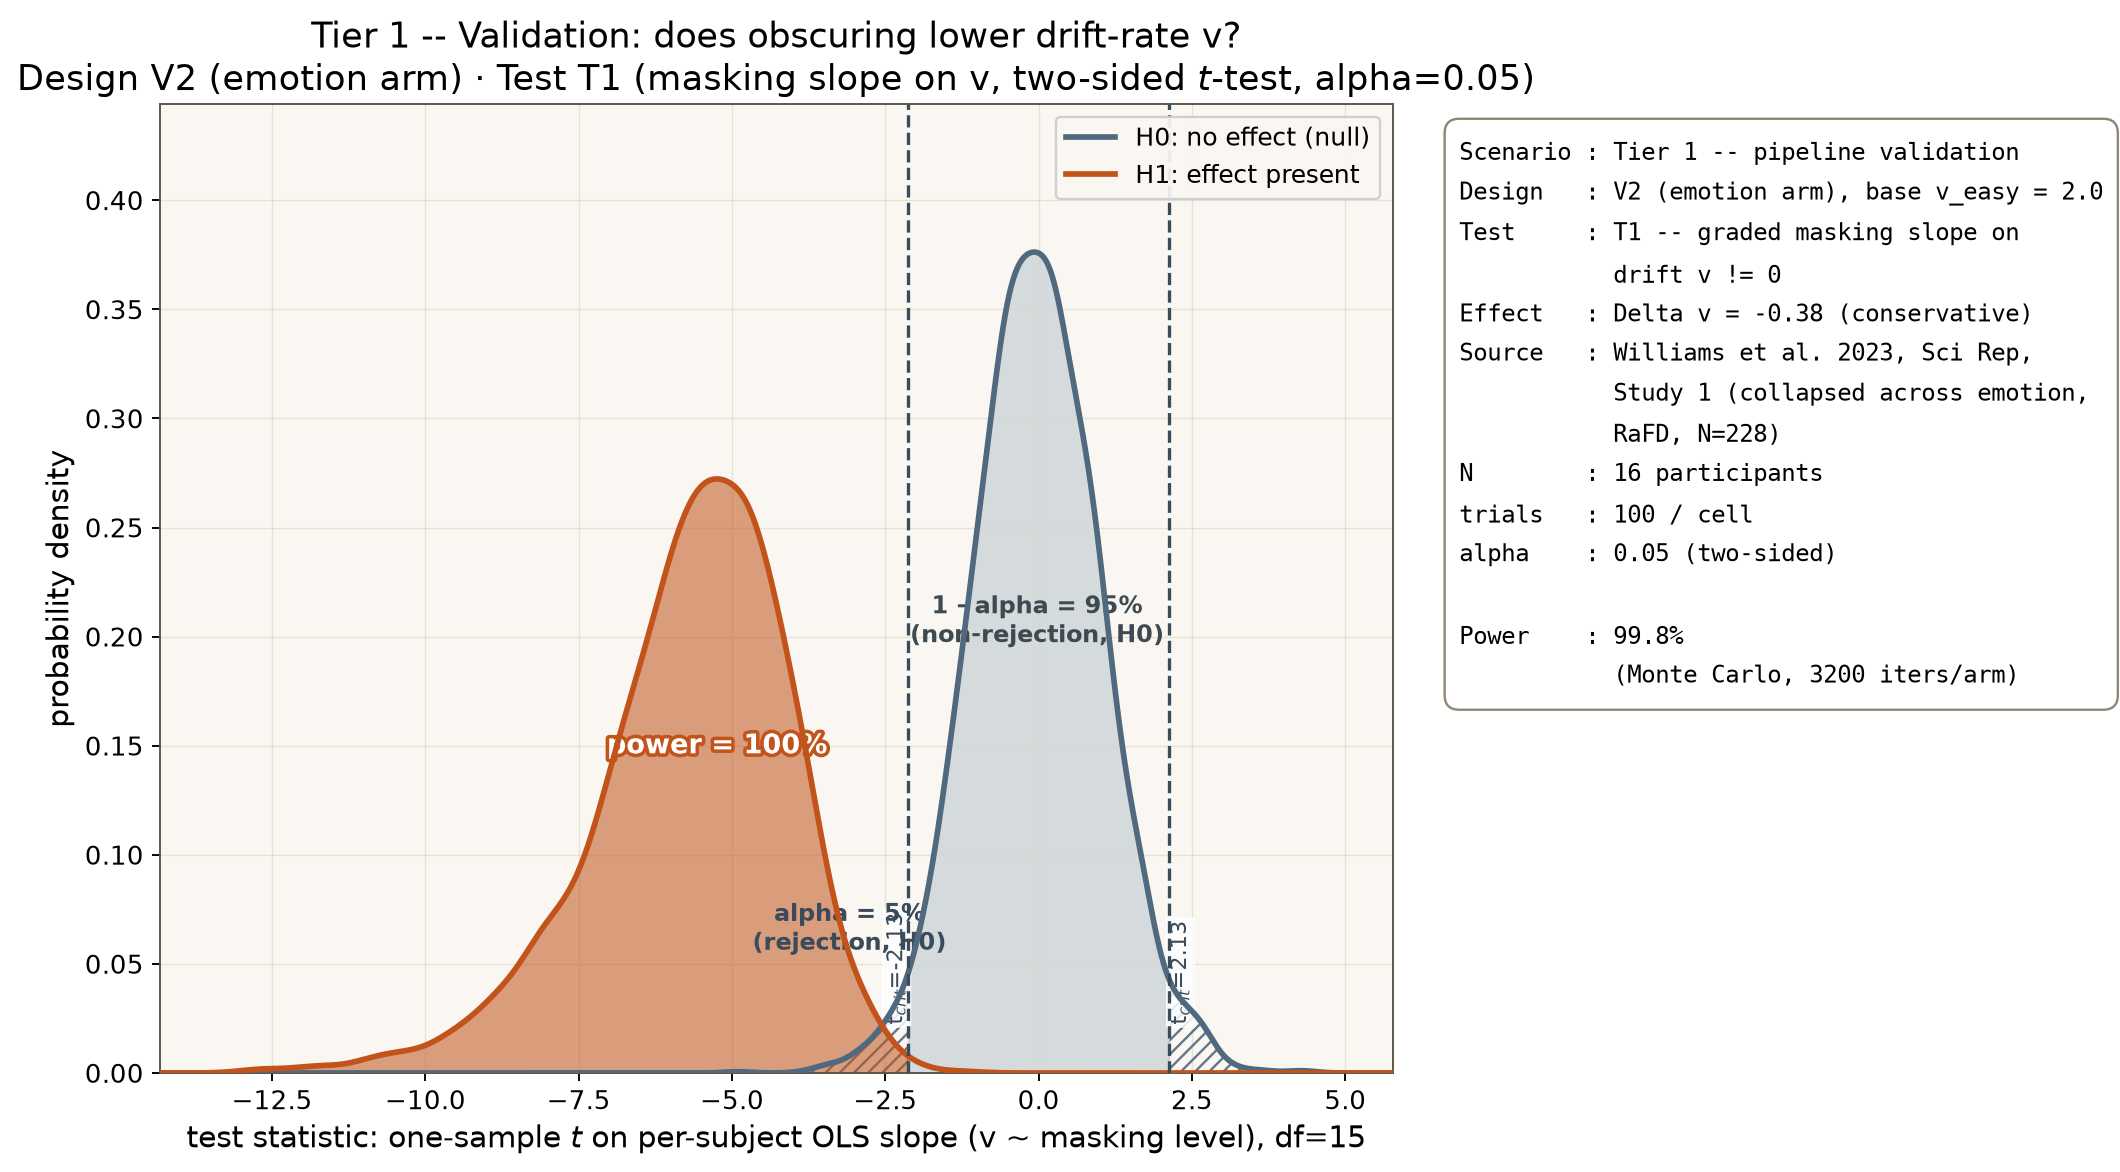
v? The effect is Williams et al. 2023's conservative
bracket (Δv = −0.38, collapsed masking slope, Study 1, RaFD, N=228). The
null distribution of the one-sample t-statistic on each subject's OLS slope of recovered drift
against masking level (centered at t=0) is overlaid against the alternative distribution under the
true conservative effect, shifted far into the negative tail. Because the effect is this large
relative to the N=16 sampling noise, the two distributions barely overlap: achieved power is
99.8% — this pipeline-validation claim is essentially guaranteed to be detected at
this N. The honest reading: N=16 is already far more than this test needs, and the real constraint
on this tier is practical (recruit a small, cheap validation cohort), not statistical.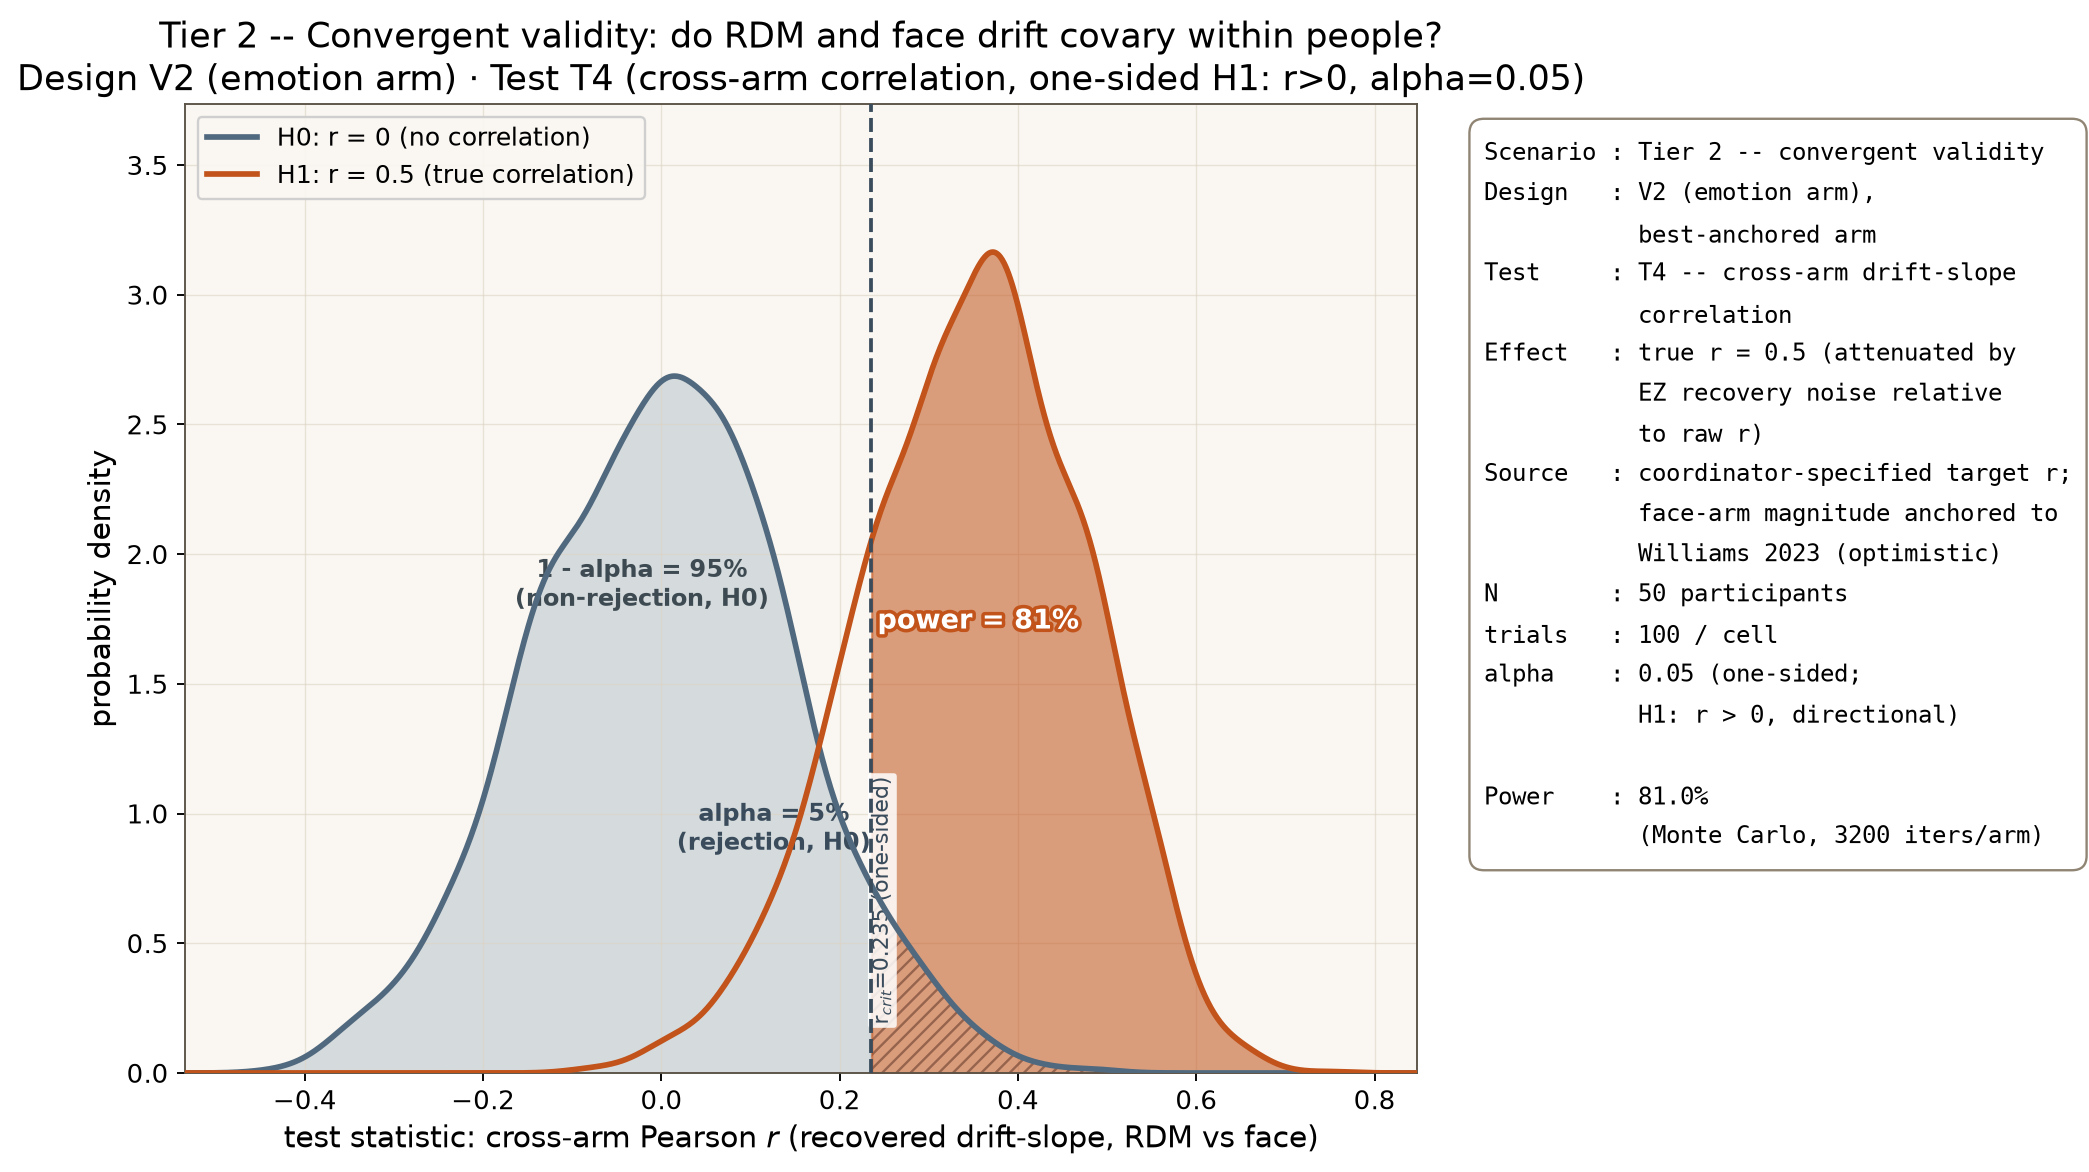
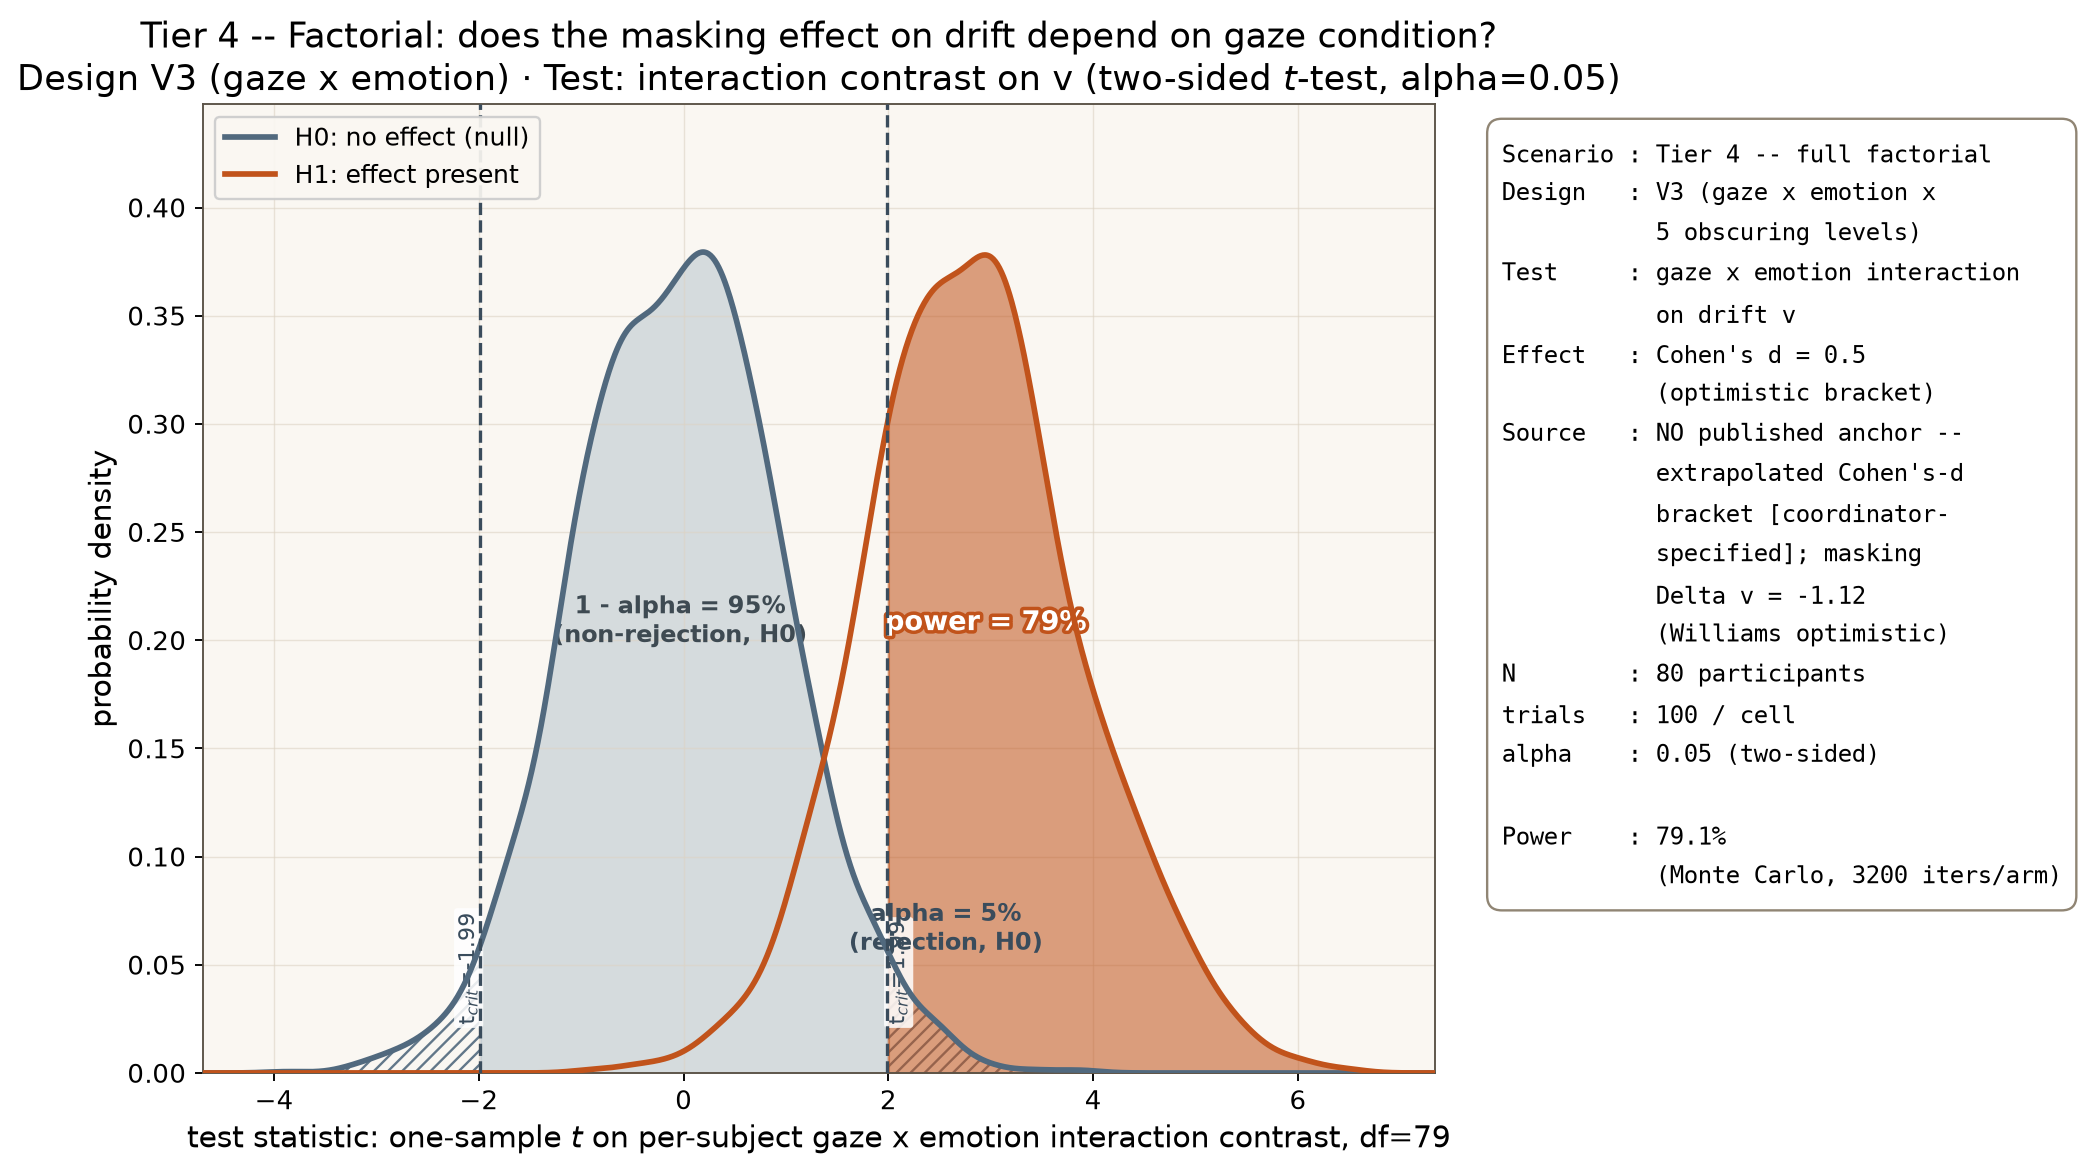
v, N = 80,
100 trials/cell, α = 0.05 two-sided. No published anchor exists for this
interaction, so the effect is an extrapolated Cohen's d = 0.5 (optimistic
bracket, paired with Williams's optimistic masking Δv = −1.12); under the
conservative d = 0.3 bracket this contrast is not reachable within the simulated N
grid. The null distribution (interaction contrast t centered at 0) and alternative distribution
(shifted positive under the injected interaction effect) are shown with both two-sided critical
values. Achieved power is 79.1%, essentially at the report's N=80 / 80%-power
threshold for the optimistic bracket — this is the design's most fragile confirmatory claim: it
only clears 80% power under the optimistic effect size, and is not reached at all under the
conservative one without increasing N well beyond 80.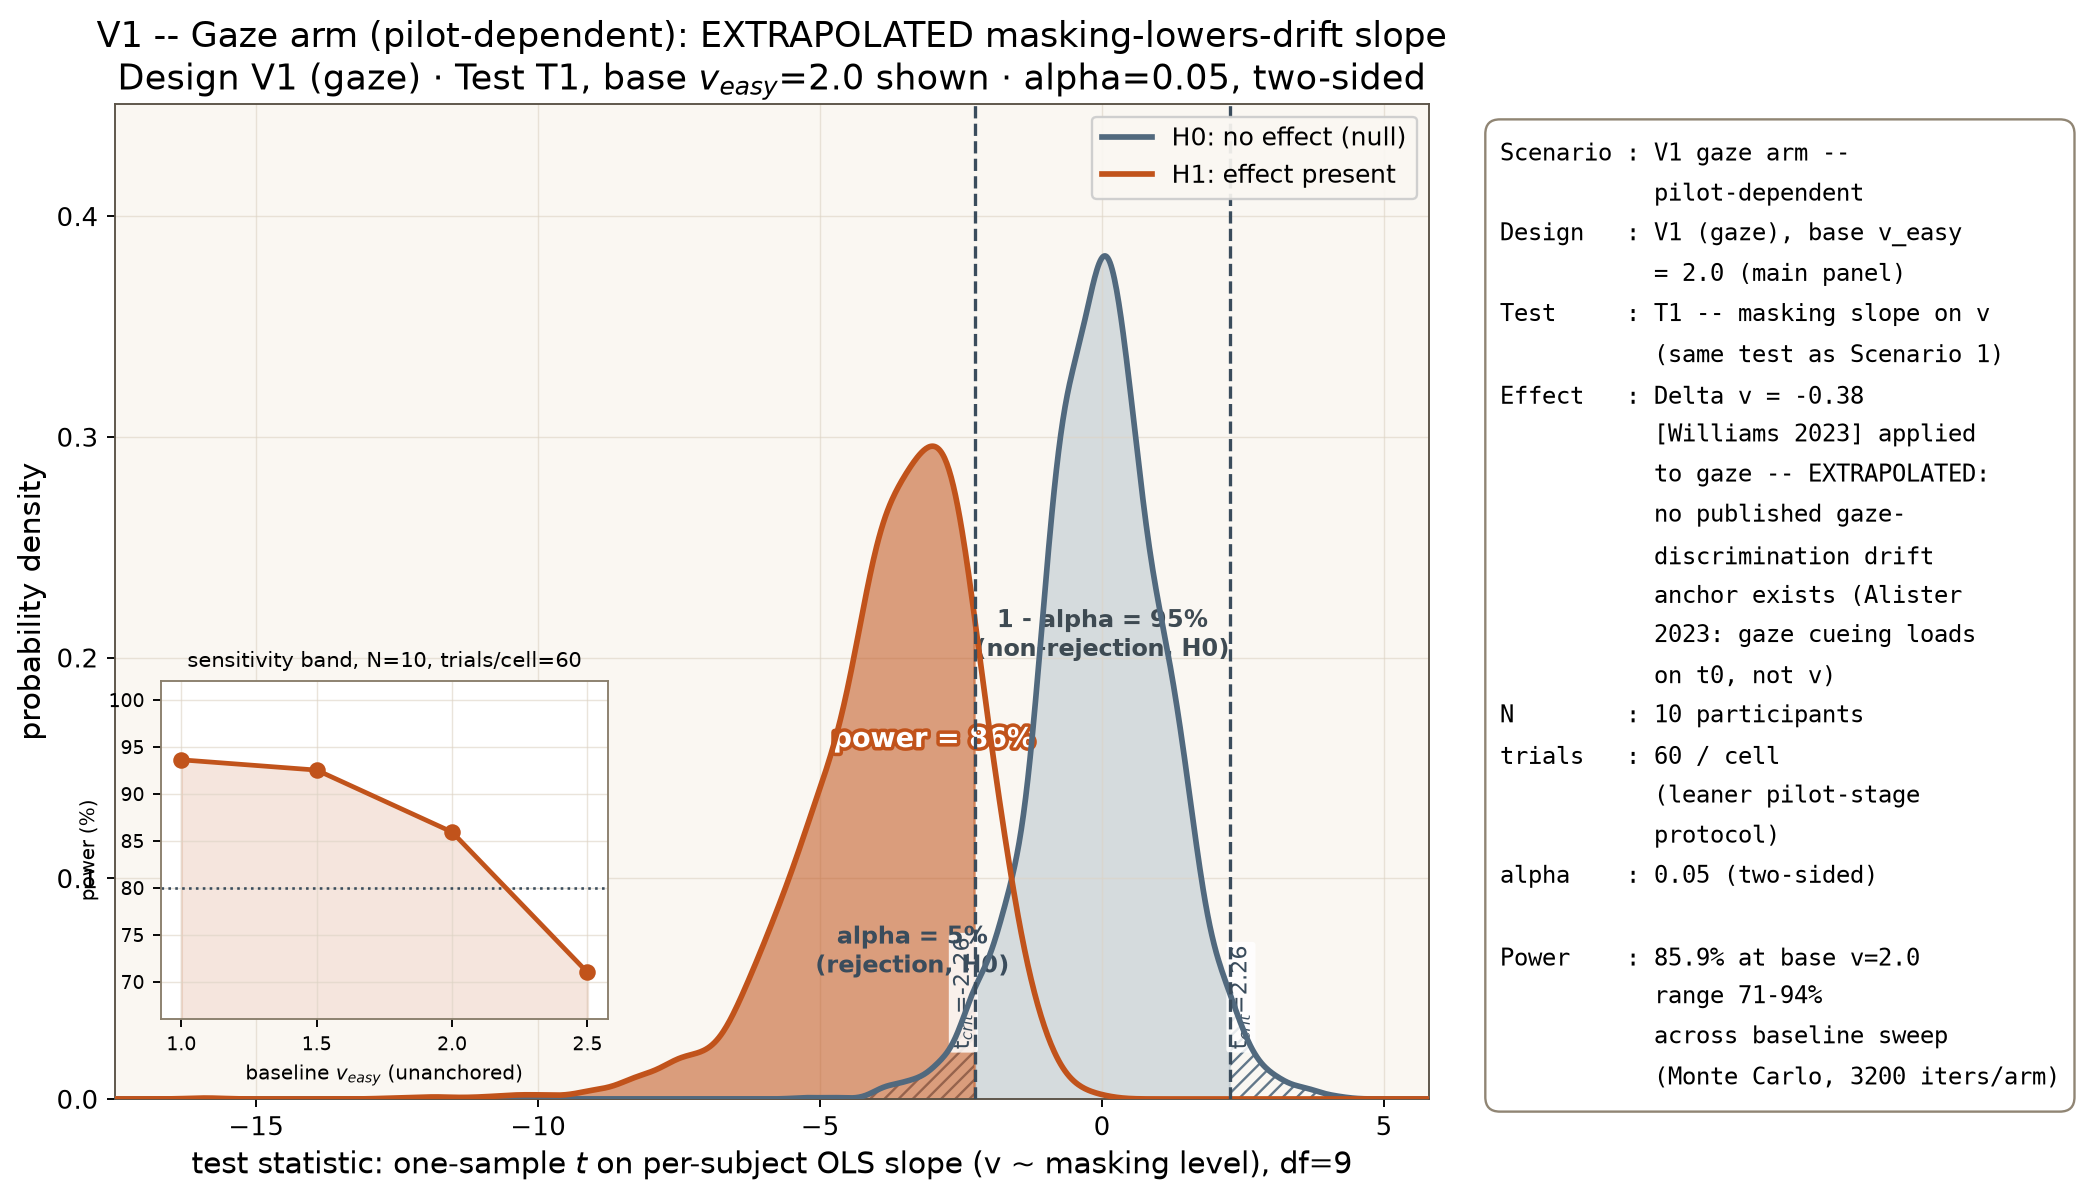
Figures
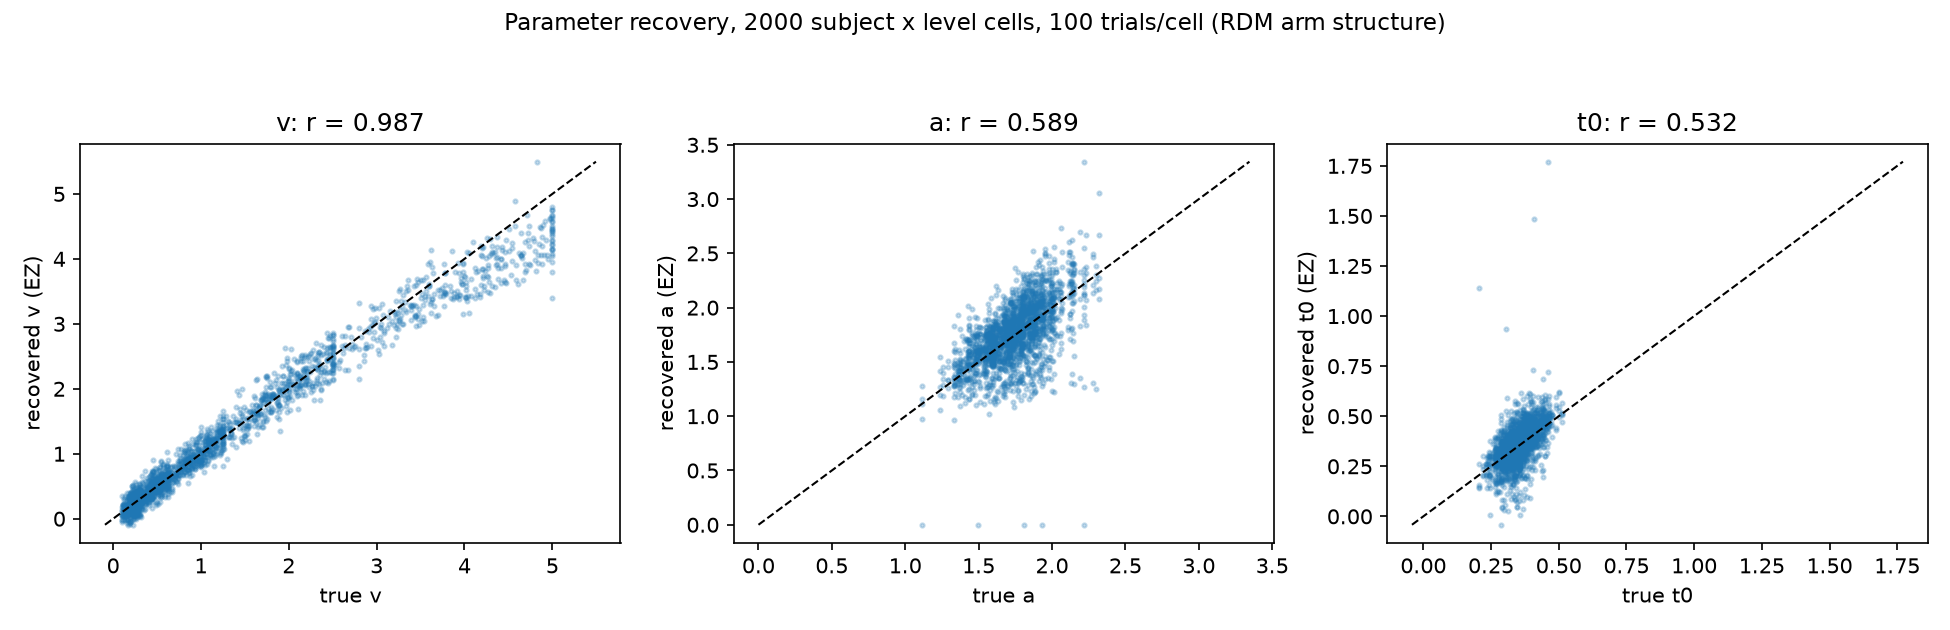
v recovers tightly
(r=0.99); boundary separation a and non-decision time t₀ are visibly
noisier (r≈0.53–0.59) — the empirical basis for the recovery caveat below.The recovery caveat — EZ recovers v well, a/t0 poorly
Parameter recovery at the simulated trial budget (n=2000 synthetic subjects, EZ
recovery): r_v = 0.99 (excellent), r_a = 0.59, r_t0 = 0.53
(both weak). RT-variance inflation ≈ 3.95.
Drift is recovered cleanly; boundary and non-decision are not, at these trial counts
with EZ. T2's "drift-specific" claim leans on a/t₀ staying null — a
parameter EZ recovers poorly here. To defend drift-specificity credibly, raise trials/cell and/or fit
hierarchically (HDDM) rather than per-subject EZ. T2's low nominal N is necessary but
not sufficient — recovery quality, not detection power, is its real constraint.
The gaze arm (V1) is pilot-dependent
There is no published drift-rate estimate for gaze-direction discrimination (Alister 2023 shows gaze cueing is a non-decision-time effect, not drift; Palmer, Caruana, Clifford & Seymour 2018 fit no DDM at all). V1's numbers above assume the masking→v mechanism transfers to a gaze-discrimination task — plausible (it is a perceptual discrimination like RDM) but unverified. A short pilot (~8–10 subjects) to pin baseline gaze-discrimination v and confirm masking lowers it is a prerequisite before committing V1's sample size. This is the highest-novelty arm precisely because the number does not exist yet — see Gaps & open questions §1.
Assumptions and their provenance
| Quantity | Value used | Source |
|---|---|---|
| RDM drift vs. coherence | μ′ = k·x, k ~ N(21, 6) between subjects; coherence x ∈ {3.2, 6.4, 12.8, 25.6, 51.2}% | Palmer, Huk & Shadlen 2005PDF, Table 2 (k range 9–28) |
| RDM bound / non-decision | A′ ≈ 0.71, t₀ ≈ 0.35 s | Palmer, Huk & Shadlen 2005PDF |
| Face masking → drift (max drop) | Δv = −0.38 (conservative) … −1.12 (optimistic) across ~5 graded levels; Δv = −0.25 sensitivity floor (see row below) | Williams et al. 2023PDF: collapsed lower-mask b=−0.38 (Study 1, N=228) → −0.65 (Study 2); happy/sad up to −1.12. Cross-manipulation extrapolation: Williams' manipulation is binary garment occlusion (removes a face region), not the graded Mondrian visual-noise mask used here (adds noise / lowers contrast). Same DDM construct (signal-to-noise → v), different geometry — to be re-estimated from pilot. Triangulated with the closest in-kind precedents: Kalhan et al. 2022 (CFS/Mondrian on faces → measurable drift) and Schrader et al. 2023 (graded degradation → graded v drop). |
| Face masking → drift (shallow-slope sensitivity) | Δv = −0.25 per collapsed contrast (below Williams' −0.38 conservative bracket) | Covers the possibility that a graded Mondrian noise mask produces a smaller per-level drift drop than Williams' binary occlusion. Powering the Tier-1 validation slope test on Δv = −0.25 keeps N ≈ 16 comfortably >80% (the effect is still large relative to N=16 sampling noise); the convergent-validity and equivalence tiers are unaffected because they key off the cross-arm correlation, not the absolute Δv. Rationale: anchor-search report §5(b). |
| Face bound / non-decision | a ≈ 1.75; t₀ ≈ 0.35 s (assumed) | Williams 2023PDF (a); t₀ assumed — not reported |
| Baseline (unmasked) discrimination drift | v_easy ~ N(2.0, 0.5); V1 swept over {1.0, 1.5, 2.0, 2.5} | No literature anchor — see Gaze pilot section |
| Emotion arm (V2) masking slope | same as Williams | Sawada 2022 paywalled/unavailable — direction only |
| Gaze arm (V1) drift | no anchor — pilot-dependent | Alister 2023 finds gaze cueing is a t₀ effect (v inclusion 3–13%); Palmer/Caruana/Clifford/Seymour 2018 give stimulus calibration only (cone ½-diff ≈ 10°) |
Caveats
- Williams masking is binary garment occlusion (masked/unmasked, and it removes a face region); our manipulation is a graded Mondrian visual-noise mask (it adds noise / lowers contrast). This is an untested cross-manipulation extrapolation on the same DDM construct (signal-to-noise → v), not a same-mechanism transfer: the per-level slope is assumed linear and must be re-estimated from pilot data. The closest in-kind precedents — Kalhan 2022 (CFS/Mondrian on faces) and Schrader 2023 (graded degradation) — support the direction but not a specific graded-noise Δv, which is why we add a Δv = −0.25 sensitivity floor above.
- EZ recovers a/t₀ poorly here; confirmatory fits should use HDDM.
- Sawada 2022 magnitude remains a genuine gap (library access needed) — see Gaps §5.
- All N's assume the between-subject variance components used above; re-run with pilot variance estimates before finalizing.